Accreditation
The State University of New York at New Paltz Education Preparation Program (EPP) is accredited by the Council for the Accreditation of Educator Preparation (CAEP; 1140 19th St NW #400, Washington, DC 20036; www.caepnet.org) under the legacy NCATE standards. This accreditation covers initial teacher preparation and advanced preparation level programs.
View our Conceptual Framework
The Education Preparation Unit at SUNY New Paltz consists of the following departments and programs:
- Teaching & Learning
- Educational Studies & Leadership
- Art
- Communication Disorders
- Psychology
CAEP Annual Reporting Measures
SUNY New Paltz is accredited by the Council for the Accreditation of Education Preparation (CAEP) under the legacy NCATE standards. Continued accreditation mandates the display of several annual reporting measures that are important to CAEP.
1: Impact on P-12 Student Learning and Development
The goal of any Education Preparation Provider is to produce highly effective teachers who are able to maximize the learning of their P-12 students. The No Child Left Behind Act of 2001 mandated the annual testing of students in grades 3 through 8, providing a means for evaluating student learning. In the aggregate form, the data from these tests are used to evaluate teacher effectiveness in the classroom and the effectiveness of schools through a complicated statistical approach called Value Added Modeling.
This annual reporting measure is CAEP’s attempt to get teacher preparation programs to utilize this data in their own program decision making. New York is not one of the states in which these data are available to institutions of higher education. In order to investigate the impact that our completers have on P-12 students’ learning, the EPP has designed a research protocol that involves interviewing and observing a small number of program completers from the AY 2016-17 graduating class. The data collection for this process will begin in Fall 2018.Program Completer Case Studies – Research Protocol
[pending]
2: Indicators of Teaching Effectiveness
As Measured by Program Completer Case Studies and the MHSSC Employer Satisfaction Survey
Program Completer Case Studies
Much of the most direct data for this indicator will come from the research study mentioned above; data collection will begin in Fall 2018.
MHSSC Employer Survey
The Mid-Hudson School Study Council has conducted its second annual survey of regional district administrators. The survey was completed by 50 regional district administrators, 36 of whom indicated that they had hired SUNY New Paltz graduates within the last year. Data from this survey suggest that 88% of district administrators view New Paltz graduates as having a positive impact on student learning.
3: Satisfaction of Employers
As Measured by the Mid-Hudson School Study Council (MHSSC) Employer Survey
Data from this survey is rich, but two indicators in particular speak to overall employer satisfaction. According to survey results, 88% of district administrators view New Paltz graduates they have hired as being an asset to their education programs, and 57% stated that they actively seek out teachers from SUNY New Paltz to fill vacancies.
4: Satisfaction of Completers
As Measured by the SUNY New Paltz Alumni and First Destination Surveys
Alumni Survey
The Office of Institutional Research sends out an annual survey for alumni, collecting data from cohorts of graduates in 5-year increments. The 2018 Alumni Survey was sent to graduates from 1982, 1987, 1992, 1997, 2002, 2007, and 2012. Fifty-two graduates spanning this range of dates responded to the survey (29 of which were from the 2012 cohort). Collectively, 87% of these respondents either agreed or strongly agreed that the preparation they received at SUNY New Paltz was relevant to the responsibilities confronted on the job, and 90% of these respondents either agreed or strongly agreed that the preparation they received at SUNY New Paltz was effective.
First Destination Survey
The Office of Institutional Research at SUNY New Paltz began collecting survey data from 1st year alumni in 2017. This inaugural survey asked two questions of alumni who had graduated the previous year. Of the 78 respondents for these two questions, 88% either agreed or strongly agreed that the preparation they received in their education program was relevant to the responsibilities confronted on the job, and 87% either agreed or strongly agreed that the training they received in their education preparation program was effective.
5: Retention and Graduation Rates
Undergraduate Student Graduation Rates (Freshmen)
Undergraduate Student Graduation & Retention Rates (Transfer)
|
Cohort Academic Year |
2011 |
2012 |
2013 |
2014 |
2015 |
2016 |
|
Indicator |
||||||
|
1st Year Retention Rate |
87% |
85% |
88% |
79% |
100% |
84% |
|
3-Year Graduation Rate |
61% |
66% |
72% |
54% |
NA |
NA |
|
4-Year Graduation Rate |
76% |
78% |
81% |
NA |
NA |
NA |
6: Ability to Meet Licensing Requirements
As Measured By Pass Rates on the New York State Teacher Certification Examinations
We are continuously engaged in efforts to improve our programs in order to improve teaching and learning for all children. Although most of our graduates remain in New York for their careers, graduates of SUNY New Paltz are teaching across the globe. Knowing this reinforces our commitments to excellence, diversity and continuous improvement of our work in educating teachers for the future. Our goal is to produce excellent educators who engage in ongoing inquiry and intellectual work and are committed to the highest standards of professionalism, democratic citizenship, quality and high achievement in a context that affirms human diversity. One measure of our success in achieving this goal is the performance of our students on the New York State Teacher Certification Examinations. We are proud of our candidates’ test scores, which significantly exceed New York State Education Department Requirements for certification.
The following data tables are the official Title II reporting data, which has been verified and validated by the institution, New York State, and WESTAT.
Summary Pass Rates
|
Group |
N Taking |
N Passing |
Pass Rate % |
|
All program completers, 2016-17 |
199 |
187 |
94% |
|
All program completers, 2015-16 |
167 |
150 |
90% |
|
All program completers, 2014-15 |
297 |
271 |
91% |
Exam Pass Rates
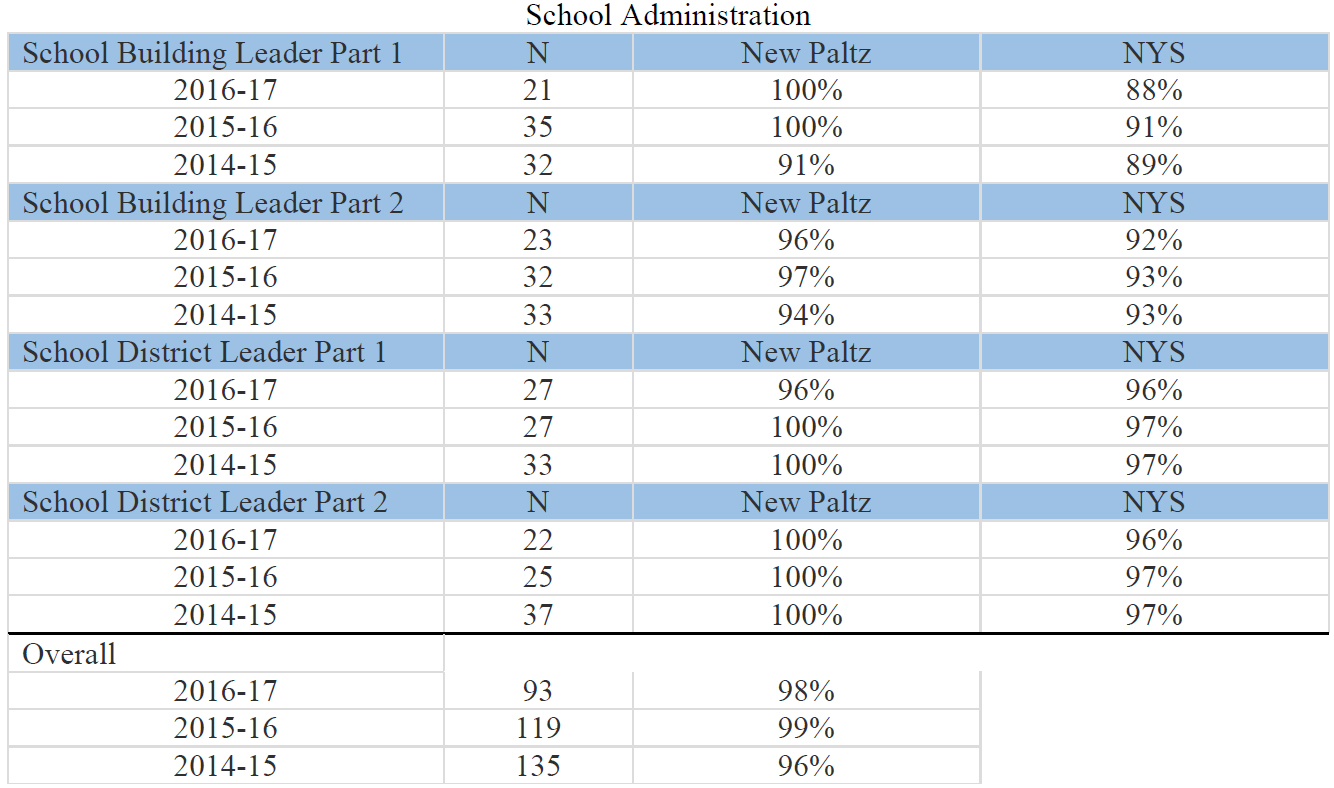
The following table shows the three-year trend in certification exam pass rates. Any exam with fewer than 10 test takers does not show a pass rate, as per standard operating protocol used in New York State and by Pearson.
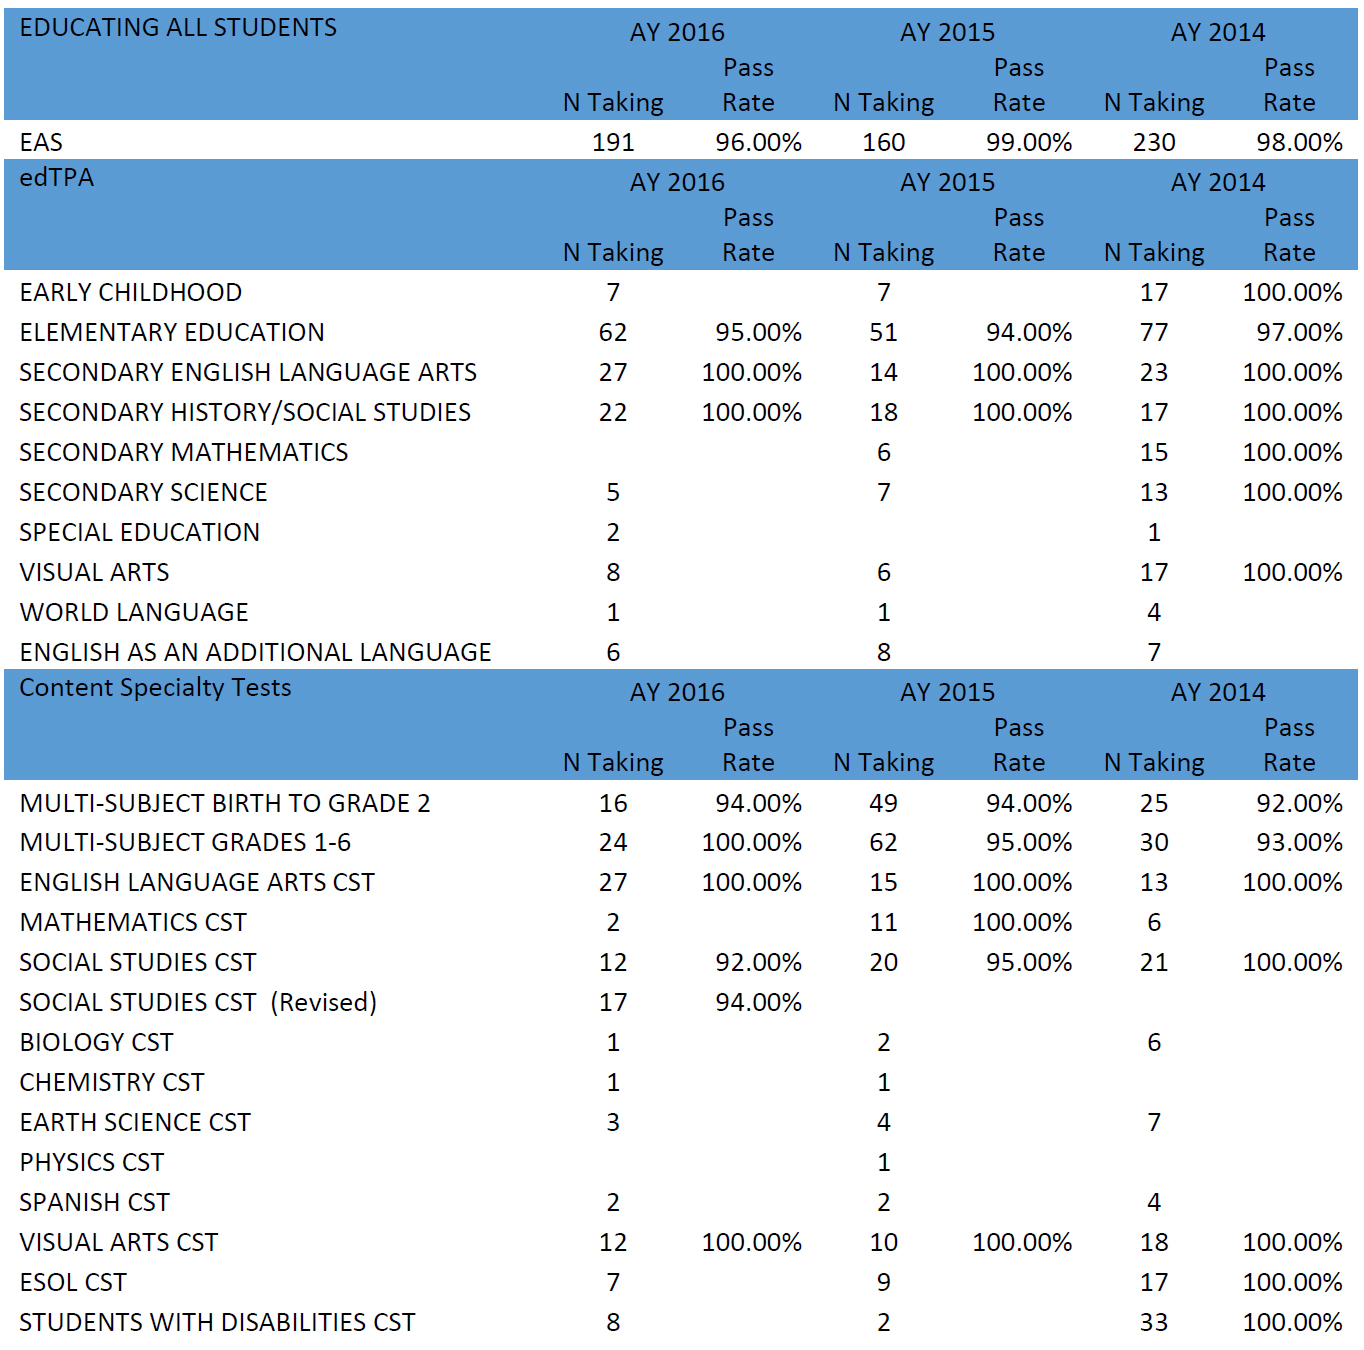
The following data tables show comparisons between SUNY New Paltz and New York State overall. These data are based on information available through the Pearson Results Analyzer. Discrepancies between these values and the values reported above are due to the source of the data (i.e., Pearson Results Analyzer, which is pre-screen data, and the Title II report, which has been reviewed and authenticated).
|
Educating All Students (EAS) |
|||
|
Academic Year |
N |
New Paltz Pass Rate |
New York State Pass Rate |
|
2016-17 |
245 |
96% |
92% |
|
2015-16 |
290 |
98% |
95% |
|
2014-15 |
246 |
100% |
97% |
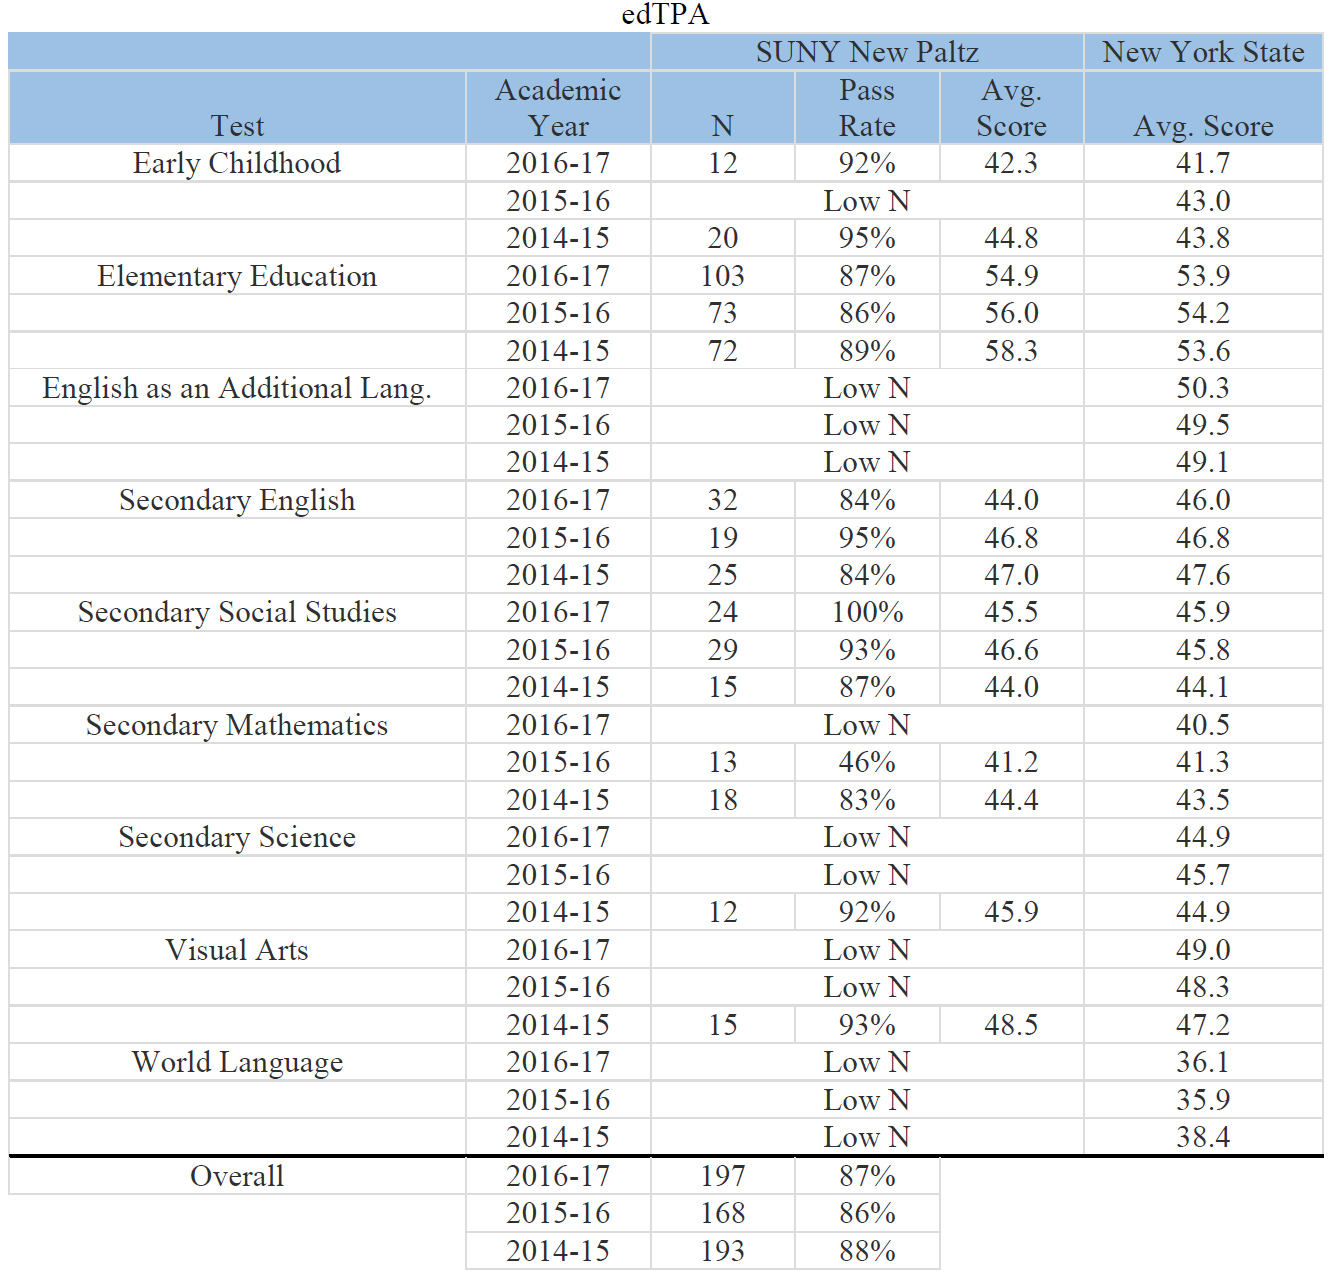
Note: Low N indicates that there were fewer than 10 exams. State policy and standard operating procedure in such cases is to withhold such information from a report in order to ensure confidentiality of the test taker.
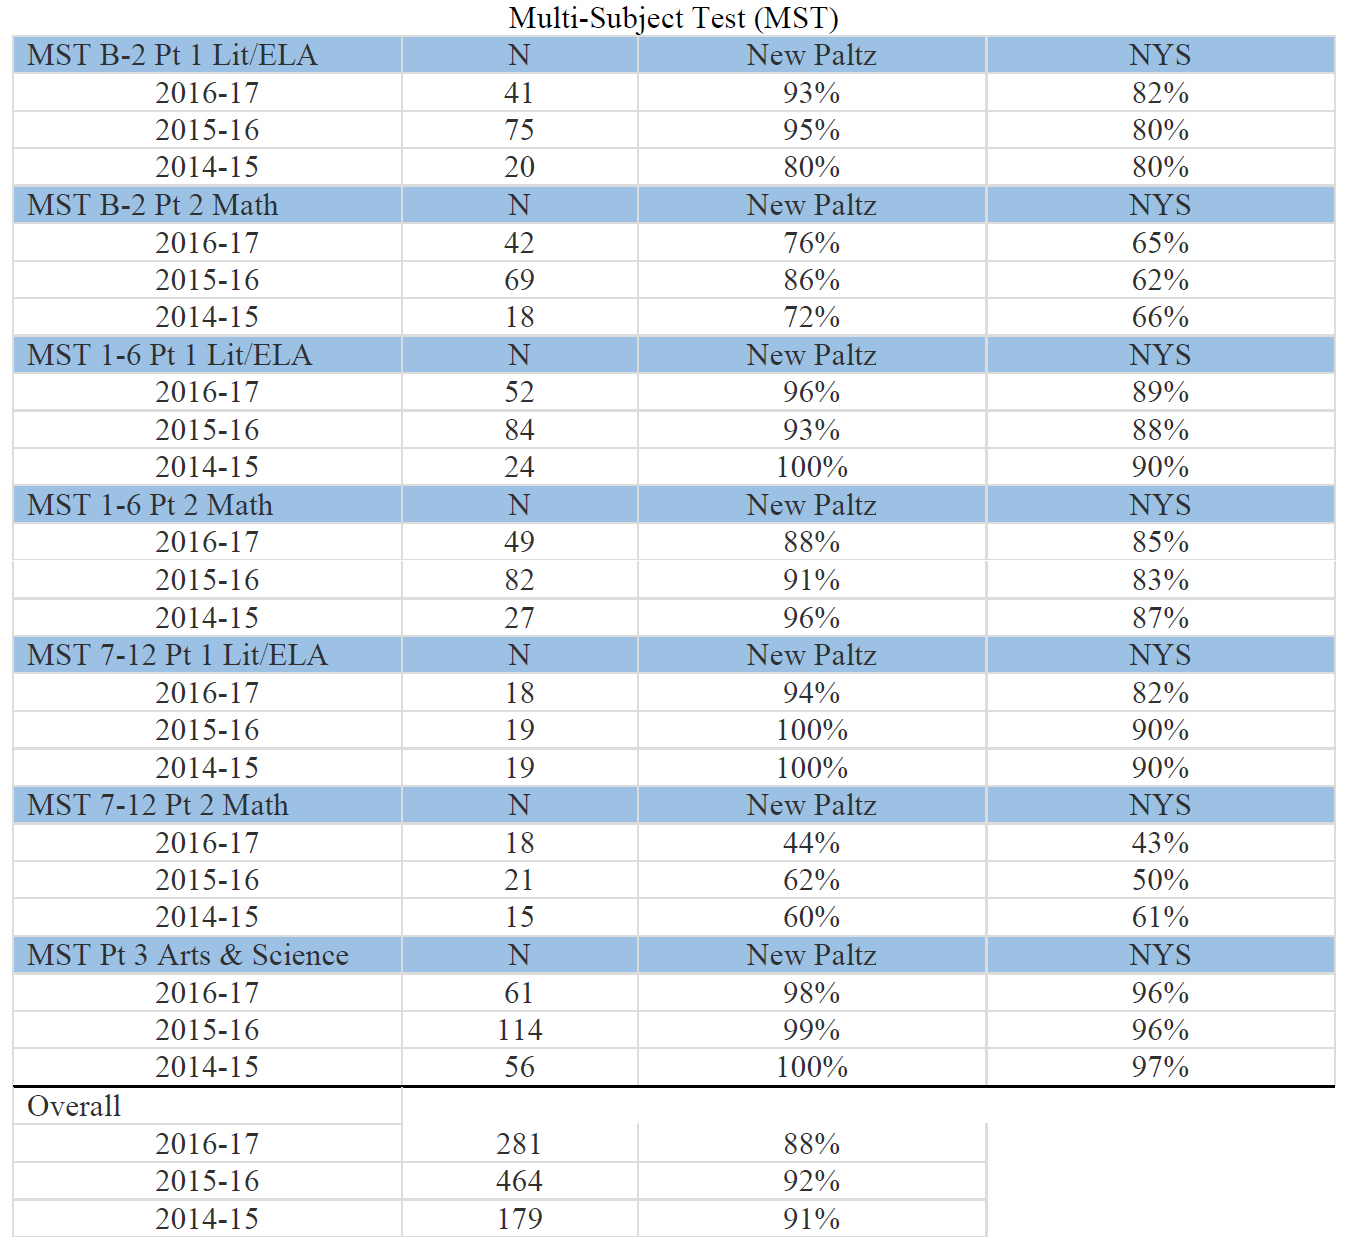
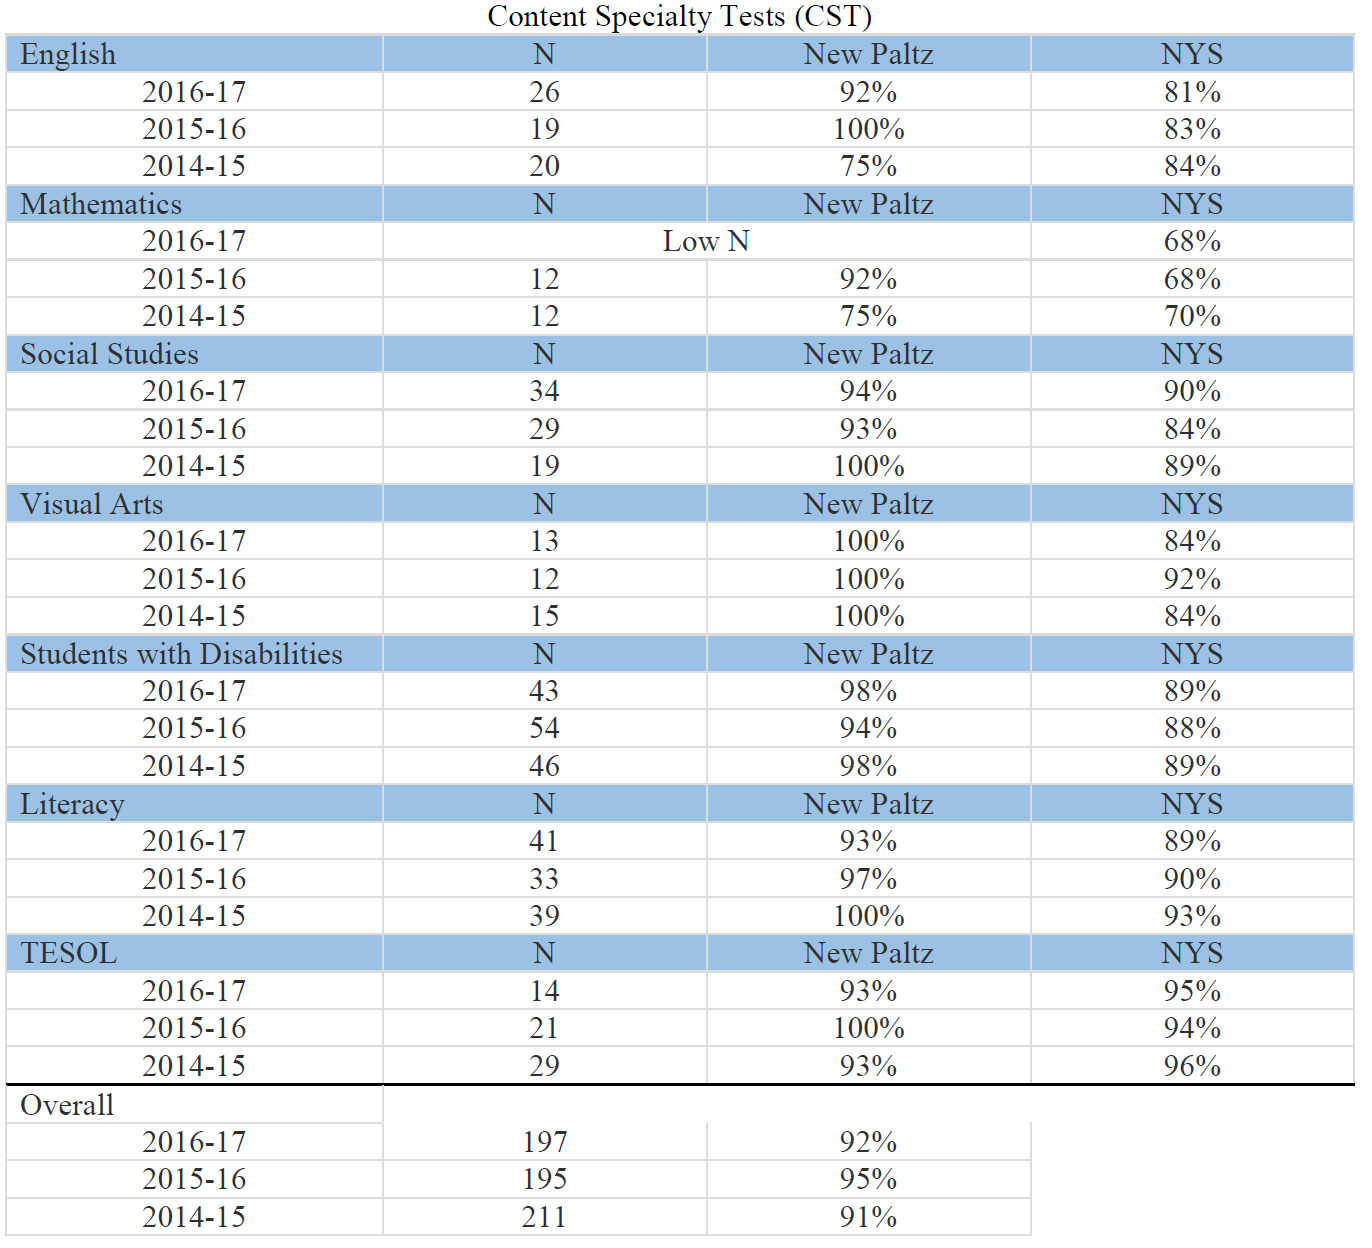
Note: Low N indicates that there were fewer than 10 exams. State policy and standard operating procedure in such cases is to withhold such information from a report in order to ensure confidentiality of the test taker. For this reason, the Foreign Languages and Science Education exams have been withheld, as all values resulted in Low-N for these exams.
7: Ability of Completers to be Hired in Education Positions
As Measured by the SUNY New Paltz Alumni Survey and First Destination Analysis
Alumni Survey
Low response rates (i.e., fewer than 10 responses per cohort year) prevent reporting on cohorts prior to 2012, but of the 28 graduates from this cohort who responded, 93% indicated that they are currently employed as education professionals. For the entire pool of 51 respondents across all 6 cohorts, 42 respondents (82%) indicated that they are currently employed as education professionals.
First Destination Analysis
The First Destination Analysis includes response information from the First Destination Survey (78 respondents), as well as information collected through social media profile review (e.g., LinkedIn profiles). The final analysis is based on data from 129 alumni from the 2016-17 graduating class, resulting in a knowledge rate (which is comparable to a survey’s response rate) of 73%. Of these graduates, 50% are employed full-time, 17% are employed part-time; and 18% are pursuing additional education. As this data collection process continues over the coming years, we will be able to utilize this data to identify trends in first-destination employment.
8: Student Loan Default Rates
Student Loan Default Rates are available and reported at the institution level.
|
Graduating Class |
Default Rate |
|
2014 |
4.0% |
|
2013 |
3.5% |
|
2012 |
2.8% |
https://nslds.ed.gov/nslds/nslds_SA/defaultmanagement/cohortdetail_3yr.cfm?sno=0&ope_id=002846